What’s the payback period? How is it calculated? These are the questions you may be asking when looking at whether it’s worth investing in solar and batteries.
What is “payback” anyway?
The idea of “payback” is simple enough – you pay for a solar and battery system upfront, so you want to know how long it will take to get your money back. But often with simple questions, the answer is complicated. Your actual payback period will depend on a number of factors that we don’t know in advance: the future price of electricity, how your electricity use changes over time, the performance of your system over and above the warranted specifications and so on. So let’s try and keep things simple and look at the two most common varieties of “payback period.” To do this, we’ll use the actual results from Evergen’s first Intelligent Energy System, which included solar, battery storage and intelligent energy management.
The cost
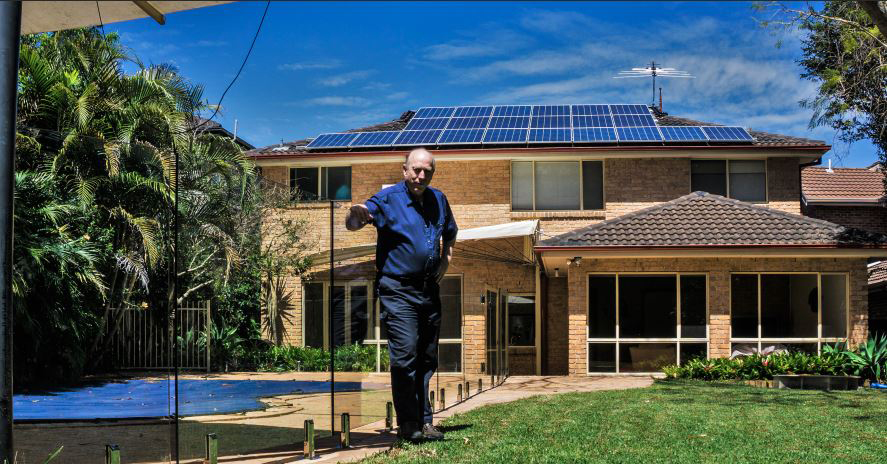
In the case of Greg MacLean, he installed a system that included solar panels that were slightly above average size at 5.7kW total capacity, and a battery that was slightly less than average size at 7.5kWh total capacity. So on balance, that system is a reasonable reflection of an average home installation. Today, that particular configuration would cost $14,900 including GST. That price includes the all of the solar panels, battery cells, integrated inverter, intelligent management system, installation, and so on.
The savings
In the first 12 months of operation, Greg’s system produced savings of $1,800.
Simple payback calculation
The most common form of payback calculation is the “simple payback”. In this calculation you simply divide the upfront cost by the savings in the first year. In this case, the simple payback would be $14,900 / $1,800 = 8.3 years. This assumes that you get the same savings, year after year, i.e. electricity prices don’t go up.
Historical electricity prices
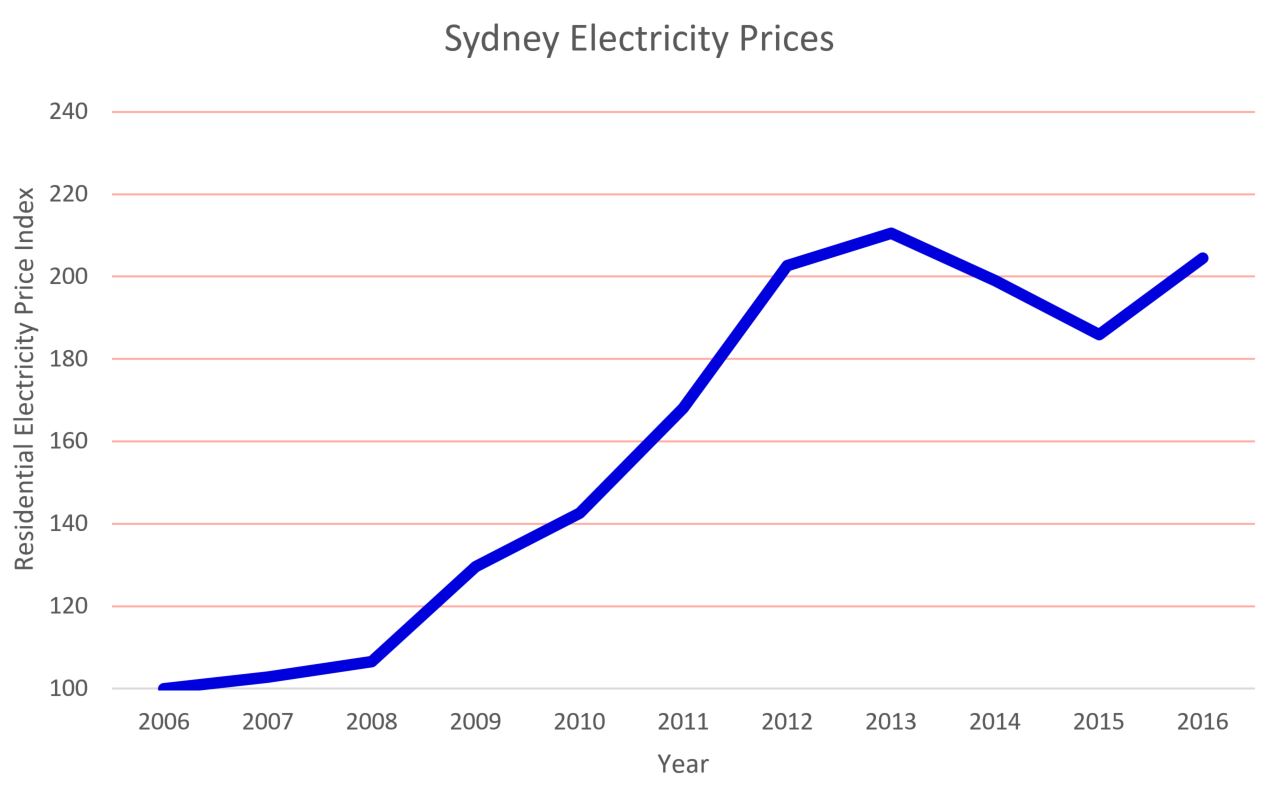
So the simple payback calculation gives a general rule of thumb, but if you want to forecast when your system might actually pay itself back, then you’ll need to consider where electricity prices might go in the future. Now as the saying goes: “past performance is no indication of future performance”. But at least it tells us what’s possible. Data from Australian Energy Regulator shows that electricity prices in Sydney doubled in the last 10 years. That’s bad news for most people but if you own a home energy system, where you’re using your own renewable energy, that means more savings.
Historical payback calculation
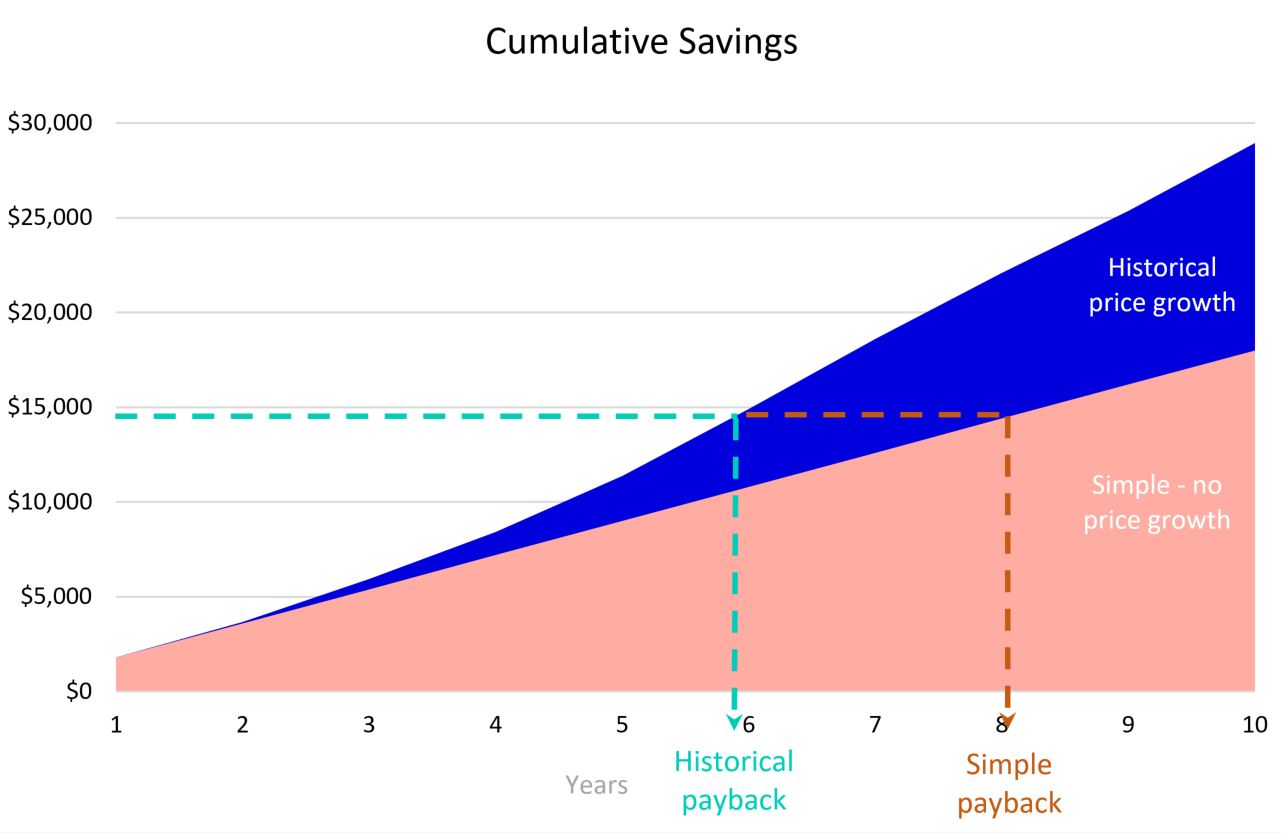
The graph below shows where the savings would end up if electricity prices in the future rise at the same rate as they have in the past 10 years. The impact of those price rises is significant. Taking into account the historical price rise trajectory, the payback period reduces from 8.3 years in the simple payback calculation to just 5.9 years.
The verdict
The simple payback calculation is sort of OK as a way to benchmark the performance of a solar battery system. But it’s got it’s limitations. If you take just the historical rate of electricity price growth into consideration, then the payback calculation comes down from 8.3 years to just 5.9 years in this example. Another way of looking at that is that the additional savings you could earn between 5.9 and 8.3 years would be over $7,000. Compared to the upfront cost of the system, that is a huge amount of savings that is not being taken into account using the simple approach.
It’s also interesting to look in the graph above at the accumulated savings out for 10 years. In the historical price growth example, the total savings over 10 years is $29,000!
So while we all hope that electricity prices in the future don’t rise as much as they have in the past, at least for owners of a home energy system, if prices do go up, so do the savings.
Request a quote for your Intelligent Home Energy System installation today